
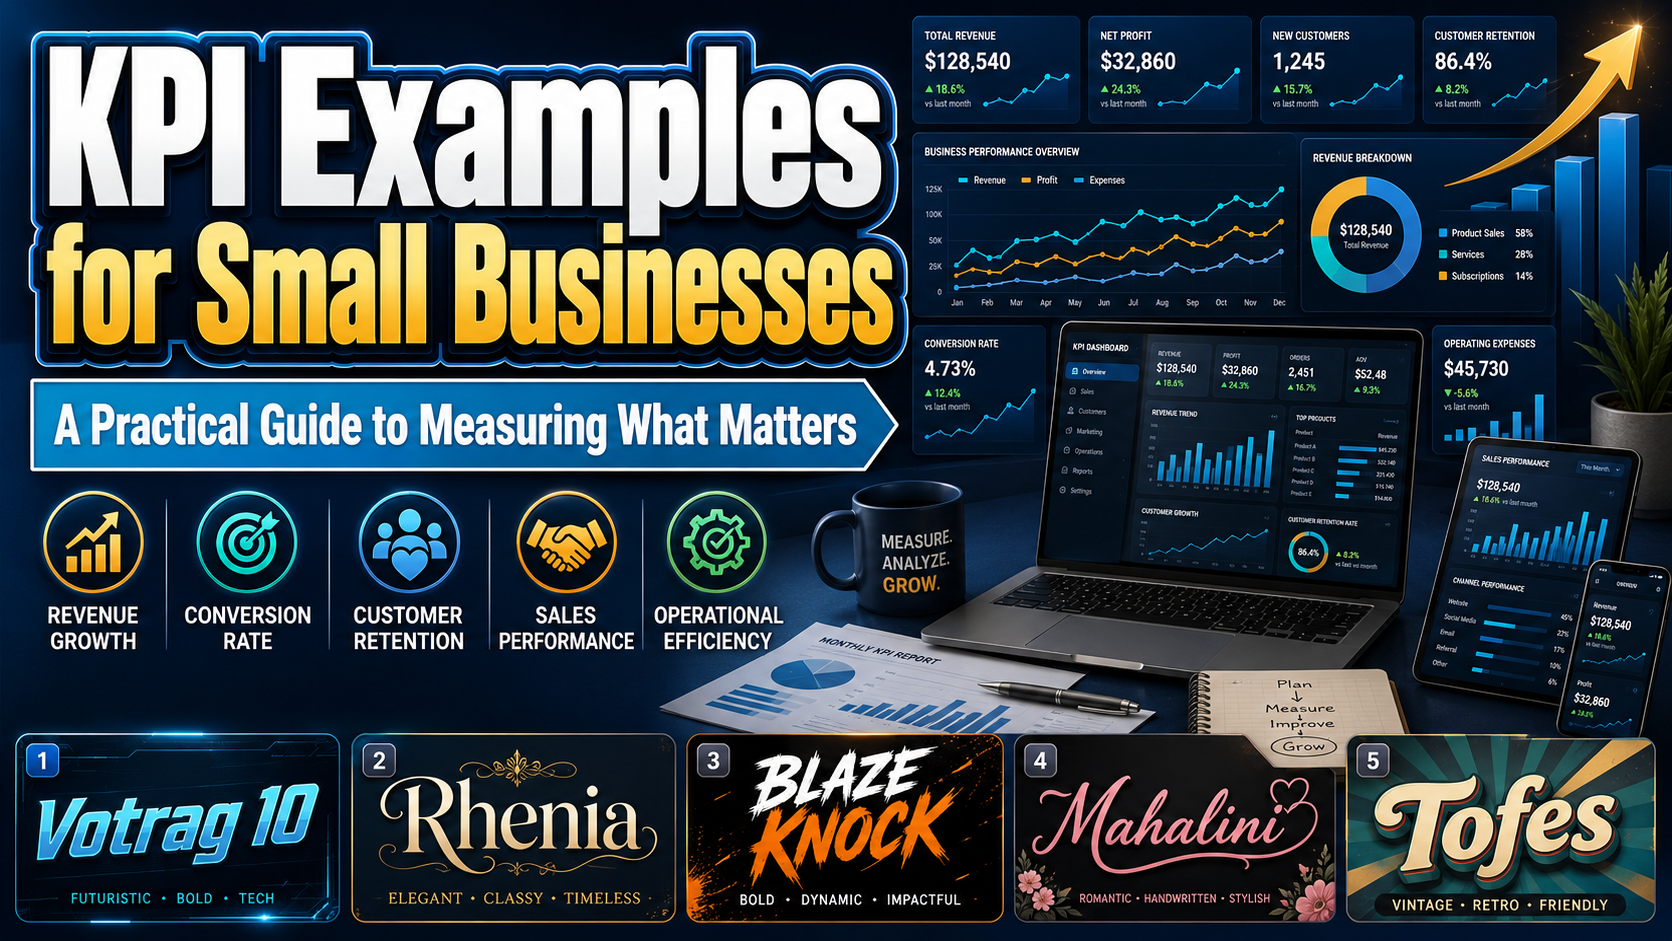
The most useful KPI examples for small businesses are not the numbers that make a dashboard look impressive. They are the measurements that show whether the company is approaching a goal and what the owner should do next.
Begin with three to five priorities, such as improving cash stability, increasing profitable sales, reducing delivery delays, or strengthening customer loyalty. Assign one or two KPIs to each priority, define the formula and target, identify the data source, and choose an owner. A focused scorecard is easier to maintain and more actionable than dozens of disconnected metrics.
A KPI should answer a management question. Revenue alone cannot show whether sales are becoming more profitable. Website traffic cannot show whether visitors become customers. Followers cannot show whether a campaign produces sustainable returns.
What Makes a Metric a Useful KPI?
A metric becomes a KPI when it is connected to an objective, reporting period, target, accountable person, and possible action. Small businesses should also combine lagging indicators, such as monthly revenue, with leading indicators, such as qualified leads, accepted quotations, repeat visits, or available production capacity.
Financial KPI Examples
| KPI | Basic Calculation | What It Shows |
|---|---|---|
| Revenue growth rate | (Current revenue − Previous revenue) ÷ Previous revenue × 100 | Whether sales are expanding or contracting |
| Gross profit margin | (Revenue − COGS) ÷ Revenue × 100 | How much revenue remains after direct costs |
| Operating cash flow | Operating cash received minus operating cash paid | Whether normal activity is generating cash |
| Cash runway | Available cash ÷ average monthly cash burn | How long current reserves can support the business |
For example, $50,000 in revenue and $30,000 in cost of goods sold produce $20,000 in gross profit and a 40% gross margin. This percentage can reveal pricing pressure, supplier increases, excessive discounting, or an unprofitable product mix. The standard gross margin formula divides gross profit by net sales.
Operational KPI Examples
| KPI | Basic Calculation | What It Shows |
|---|---|---|
| Order cycle time | Total fulfillment time ÷ completed orders | Average time from order to completion |
| On-time fulfillment rate | On-time orders ÷ total orders × 100 | Reliability against promised dates |
| Inventory turnover | COGS ÷ average inventory | How efficiently stock is sold and replaced |
| Return or rework rate | Returned or corrected orders ÷ total orders × 100 | Quality, accuracy, and fulfillment problems |
Track the reason behind a failure, not only the total. A return caused by a product defect requires a different response from one caused by inaccurate photography, damaged packaging, incorrect sizing, or unclear client instructions.
For service businesses, useful operational KPIs may also include project completion time, billable utilization, missed deadlines, revision frequency, and employee capacity.
Marketing and Sales KPI Examples
| KPI | Basic Calculation | What It Shows |
|---|---|---|
| Conversion rate | Conversions ÷ visits or interactions × 100 | How effectively attention becomes action |
| Customer acquisition cost | Acquisition spending ÷ new customers | Cost of gaining each new buyer |
| Return on ad spend | Conversion value ÷ advertising cost × 100 | Revenue generated from paid advertising |
| Average order value | Revenue ÷ number of orders | Average spending per transaction |
An online store receiving 5,000 visits and 100 orders has a 2% purchase conversion rate. If it spends $2,000 to acquire 100 new customers, its CAC is $20. If $1,000 in advertising produces $5,000 in tracked revenue, ROAS is 500%.
Google defines conversion rate as the frequency with which an advertising interaction leads to a conversion, while ROAS compares conversion value with advertising cost. Revenue is not the same as profit, so ROAS should always be reviewed alongside gross margin, refunds, and acquisition costs.
Average order value adds another useful perspective. Monthly revenue of $20,000 from 400 orders produces an AOV of $50. Shopify calculates AOV by dividing revenue by order count, while Stripe defines CAC as acquisition costs divided by newly acquired customers.
Customer Satisfaction and Retention KPI Examples
| KPI | Basic Calculation | What It Shows |
|---|---|---|
| Repeat purchase rate | Repeat customers ÷ total customers × 100 | How often buyers return |
| Customer retention rate | (Ending customers − new customers) ÷ starting customers × 100 | How effectively relationships are maintained |
| Net Promoter Score | % Promoters − % Detractors | Willingness to recommend the business |
| Customer satisfaction score | Positive responses ÷ total responses × 100 | Satisfaction with a specific experience |
For NPS, scores of 9–10 are promoters, 7–8 are passives, and 0–6 are detractors. The result ranges from −100 to +100. The written feedback behind the score is often more useful than the number alone because it explains what customers value or dislike.
Service-focused companies can also track first-response time, resolution time, complaint recurrence, and quotation acceptance rate. Ecommerce brands may prioritize repeat purchases, refund rate, delivery satisfaction, and customer lifetime value.
How to Implement a KPI System
Set a baseline before selecting targets. Document the formula, data source, owner, review schedule, and action threshold for every KPI. Review fast-moving marketing and operational indicators weekly, while broader financial and retention trends may be more meaningful monthly or quarterly.
Keep definitions consistent. Do not compare gross revenue in one period with net revenue in another. Use the same treatment for refunds, taxes, discounts, canceled orders, and advertising costs throughout every report.
Add a brief explanation to each KPI review: what changed, why it changed, what action will follow, and when the result will be checked again. This turns a dashboard into a management system rather than a passive collection of charts.
Jump to Recommended Fonts
Votrag 10 Modern Font | Rhenia Elegant Display Font | Blaze Knock Sport Font | Mahalini Serif Font | Tofes Modern Serif Font
Professional typography can improve hierarchy across dashboards, proposals, annual reviews, campaign reports, and investor presentations. The right display font also connects business data with a recognizable brand identity.
1. Votrag 10 Modern Font

Votrag includes five weights, from Thin to Bold, with clean and textured versions for a total of ten fonts. Its rounded sans-serif construction feels contemporary and approachable, while the weight range supports clear hierarchy across reports, digital interfaces, branded presentations, and campaign graphics.
PROS: Ten styles, flexible hierarchy, clean and textured options, modern personality.
BEST FOR: Startup dashboards, technology brands, business reports, packaging, and presentation headlines.
2. Rhenia Elegant Display Font

Rhenia combines soft curves and vertical emphasis with a refined balance of modern and classic influences. Its two-style sans-serif family works well for premium headings, elegant business identities, product labels, editorial layouts, and polished performance report covers.
PROS: Elegant silhouette, two styles, polished display presence, versatile brand appeal.
BEST FOR: Consulting, fashion, premium services, magazines, and sophisticated presentations.
3. Blaze Knock Sport Font

Blaze Knock uses blocky square serifs, powerful all-cap forms, and horizontal details that suggest speed and momentum. Outline and inline-shadow variations add depth to scoreboards, promotional campaigns, merchandise, and performance-focused graphics that need immediate visual energy.
PROS: Bold visibility, layered variations, athletic energy, strong headline impact.
BEST FOR: Fitness businesses, sports teams, gyms, competitions, and motivational KPI graphics.
4. Mahalini Serif Font

Mahalini is a luxurious serif with a timeless personality suited to brands that want reports and marketing materials to feel refined. Alternates, ligatures, multilingual support, and polished letterforms make it useful across logos, covers, packaging, premium presentations, and editorial campaigns.
PROS: Sophisticated appearance, OpenType features, multilingual support, creative flexibility.
BEST FOR: Beauty, fashion, hospitality, luxury products, and executive presentations.
5. Tofes Modern Serif Font

Tofes combines clean lines with modern serif elegance, giving business communication a professional but distinctive voice. Its alternates, ligatures, multilingual support, numbers, punctuation, and symbols make it practical for complete identity systems instead of headline use alone.
PROS: Clean structure, extensive character support, elegant details, broad versatility.
BEST FOR: Corporate branding, premium ecommerce, proposals, packaging, and editorial reports.
Comparison
| Font | Visual Personality | Strongest Use | Ideal Brand Direction |
|---|---|---|---|
| Votrag | Modern and approachable | Dashboards and presentations | Startup and technology |
| Rhenia | Refined and elegant | Report covers and premium branding | Consulting and fashion |
| Blaze Knock | Powerful and energetic | Scoreboards and campaign graphics | Sports and fitness |
| Mahalini | Luxurious and timeless | Executive and editorial materials | Beauty and hospitality |
| Tofes | Clean and sophisticated | Proposals and identity systems | Corporate and premium retail |
Common Mistakes When Tracking Small Business KPIs
The first mistake is tracking too many numbers without deciding which actions they support. Vanity metrics such as impressions, followers, and total traffic may rise while profit, cash flow, retention, or fulfillment quality declines. Every KPI should have a purpose, owner, target, and defined response when performance moves outside the expected range. If nobody knows what decision a number should influence, it probably does not belong on the main scorecard.
Another mistake is comparing inconsistent data. Changing formulas, mixing gross and net revenue, ignoring refunds, or comparing a holiday month with a normal month can create false conclusions. Document each definition, use comparable periods, and segment results when products, locations, customer groups, or acquisition channels behave differently. A company-wide average can hide both its strongest opportunities and its most serious problems.
The final mistake is reviewing a dashboard without taking action. First When conversion falls, investigate traffic quality, offer clarity, page speed, and checkout friction. When margin declines, examine pricing, discounts, supplier costs, and product mix. When satisfaction drops, study the written feedback and operational causes. Measurement creates value only when it leads to a decision, experiment, or practical improvement.
Conclusion
The right KPI examples for small businesses connect daily activity with financial health, operational reliability, marketing efficiency, and customer loyalty. Begin with a compact scorecard, maintain consistent definitions, and connect every measurement to a business decision.
Fonts from PutraCetol Studio can help present those insights through professional dashboards, reports, proposals, packaging, and branded materials. Strong performance measurement guides growth, while strong typography makes the strategy clearer, more professional, and more memorable.
Explore these fonts and many more at PutraCetol.com to build a business identity that looks professional, trustworthy, and memorable.
Additionally, if you want to explore some free typography options, you can check out Putracetol Studio on Dafont. Happy reading and designing!